

Evaluating new processes in an accounting firm – How the corona virus pandemic and redundancies messed up the evaluation
Introduction
The financial accounting sector has been undergoing a transition. The industry is becoming electrified at a rapid pace. There have also been many changes and updates to legislation and taxation in relatively short time. The industry, which traditionally consists of small offices, is slowly focusing on larger units. At the same time more people are working remotely. In many offices, this means a lot of changes. Bigger changes are often carried forward as their own projects often part of larger programs to achieve certain goals. According to McDavid and others (2013) programs are “means-ends chains that are intended to achieve some agreed-on objective(s)”. The thesis on the introduction of new process descriptions in a case-company followed one such project. The study’s objective was to evaluate how the program affected its’ intended objectives to increase quality of work and customers satisfaction.
Program evaluation
A program evaluation is a process that is used to collect information from existing policies and ongoing programs to help with improving them and/or planning and implementing new policies and programs. They investigate, among other questions, were the intended objectives met, was the program effective, was it responsible for the observed outcomes and are the observed outcomes what was intended. A program evaluation is strongly based on the expertise of the evaluator. They need to use their own existing knowledge to find the best tools and methods for the job with available resources and for evaluating the results. They often need to adapt and improvise when the research proceeds and some paths result in dead-ends and others bring forth new angles and paths for the research (McDavid, et al., 2013) (Vito & Higgins, 2015).
Methods for evaluation
There are several method options that can be used in program evaluation. Research usually prefers randomized experiments that have randomly assigned test groups participating a program with control groups that do not participate it and then these two groups are compared to evaluate the effects of the program. This is though seldom possible in program evaluation. Usually, an evaluator starts her or his job when a program has already started with no control group or preprogram data for comparison. Often research also utilizes performance measurement data that organizations collect and store in their performance measurement systems. Those are often integrated in the organization information infrastructure as a part of continuous routine monitoring of information (McDavid, et al., 2013).
For performance measurement data, organization has first defined some tangible objects to measure. For example, when measuring customer satisfaction, organization can follow, how many reclamations are coming in, and how much they result in compensations and loss of money. When defining measurements for quality, it helps to know, what customers perceive as good quality. Then organization should make sure the employers producing the services are aware of the standards and are able to produce services according to those standards. It is also important that employees can identify and supervise quality deviations themselves. Then they are able to control them before possible problems become visible to customers (Gerson & Machosky, 1993).
Information sources of the case study
The study on a case-company evaluated an ongoing program since the implementation project started in 2018 and continued to 2021. The study included preliminary survey that was sent to the whole personnel three times. First in 2018 before the whole program started, second in 2019 and third in 2021 enabling before – after comparison. The study also used statistics from performance measurement systems integrated to enterprise resource planning system (ERP). The case-company`s documents there among other information, like
- realization of key checkpoints of the main processes,
- customer reclamations,
- ended customerships and
- NPS (net promoter score) survey results.
The secondary data was mainly collected from 2019 to 2020, as the change of the ERP system in 2019 resulted previous data to be unavailable. The data on realization of quality control checkpoints was collected up until 2021. Several sources of data were used to ensure diverse perspective to study the possible effects of the program for unifying processes.
The survey on personnel opinions of new processes
The survey that was created for the study included questions concerning different objectives of the new process descriptions. The survey was intended to be short and easy to answer to ensure as much answers as possible. It included 13 Likert scale questions divided to four sections representing matters processes were hoped to improve:
- Planning and scheduling of work
- Coherent procedures
- Quality of service and customer satisfaction
- Communication and interaction
Each of the sections included also volunteer open-ended comment field.
Likert scale or Likert-type scale is typically used when dealing with statements expressing attitude, satisfaction, or perception about something (Dimitrov, 2011). It was also familiar for employees from yearly survey on the work satisfaction. The scale used in the survey did not include neutral option forcing respondents to choose how much they agree or disagree with the statements. Questions were left intentionally wide to gain overall view and to limit the material for a manageable size. Yet more precise questions would not have left as much to hypothesise and had eased the analysis.
Afterwards it became clear that the survey should have been targeted to only operative employees instead of all personnel, as some of the respondents commented that questions did not apply to their job. Defining and limiting the target group in advance within the personnel would have increased the validity of results.
The results of the case study
Results showed some improvement in several categories, but also plenty of subjects that should be addressed for further development. For example, the experienced workload of employees had risen significantly from the beginning of the study. It was also mentioned in many of the given open-ended arguments in different sections. Also, inter-functional and internal communication, though improved from previous years, seemed to be in dire need of development.
Problems affecting the evaluation
Results from 2020 material had several external factors affecting them. That made it practically impossible to separate the effects of the program from the effects of these other factors. As loss of customers was used as one indicator, the mass archiving of old customers at the end of 2019 that had been transferred from the old programs, caused a large peak to the statistics. At the beginning of 2020 the case-company started billing a charge from non-electrical invoices. This caused again a peak in both reclamations and loss of customers.
Soon after the beginning of 2020 corona pandemic reached Finland and started causing havoc. Sick leaves and quarantines increased rapidly, and many businesses were forced to shut their doors from the public. Many of those businesses had to downsize their operations. In the case-company pandemic lead to a start of co-operation negotiations. Resulting lay-offs and colleagues on sick-leaves increased the workload of the employees left to work. In the study material this could be seen in increased number of reclamations about late and undone monthly declarations and reports. On the second half of 2020 numbers were again affected by merging offices. Large number of customers left when their local office was moved somewhere else, or their accountant resigned likely due to the same reasons. Several customers announced they were following their previous accountant to other offices.
Conclusions
Due to all these external reasons, it was impossible to establish what results were due to the program for increasing quality and what were due to these other reasons. This is many times normal result with qualitative research as can be seen from figure 1 below:
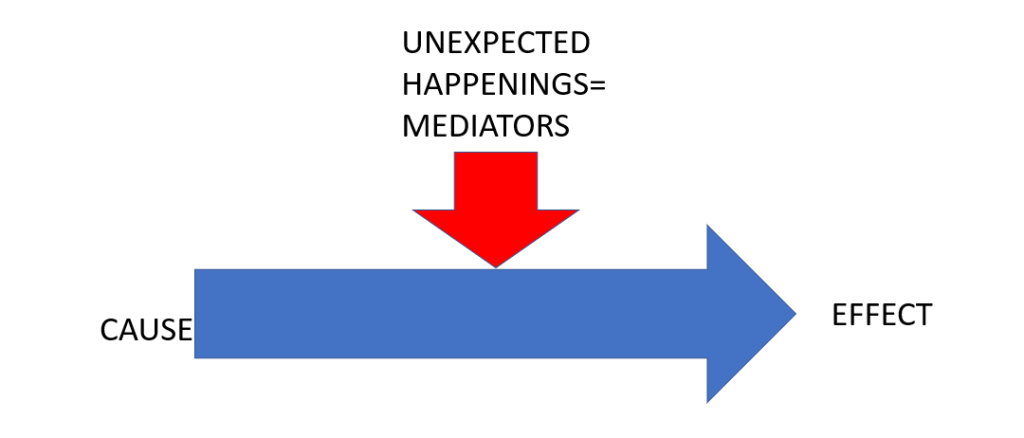
The value of the research lies precisely in how unforeseen events, i.e. mediating events, mess up the assumed consequences, i.e. the measurement results. Therefore, it cannot be directly said without statistical evidence that, for example, the clarification of customer service processes has affected the perceived quality of customer service.
For better understanding of the different reasons, it would have been beneficial to add some in-depth interviews of both personnel and customers to source material. As year 2020 was so exceptional, it would have been better if the study could have followed up the results couple of years more to see how they would have developed after the pandemic.
References
Case-company ERP, 2019,2020. Reclamations, loss of customers, NPS, quality control.
Case-company, 2018,2019,2021. Personnel survey on opinions concerning new process descriptions.
Dimitrov, D. M., 2011. Statistical Methods for Validation of Assessment Scale Data in Counseling and Related Fields. s.l.:American Counseling Association.
Gerson, R. F. & Machosky, B., 1993. Measuring Customer Satisfaction: A Guide to Managing Quality Service. s.l.:Course Technology Crisp.
McDavid, J. C., Huse, I. & Hawthorn, L. R., 2013. Program evaluation and performance measurement: an introduction to practice. 2nd ed. Thousand Oaks, California: SAGE Publications, Inc.
Roos, S., 2022, Master Thesis: Implementation of new process descriptions – Program evaluation at a Case company
Vito, G. F. & Higgins, G. E., 2015. Practical program evaluation for criminal justice. s.l.: Routledge / Taylor & Francis Group.