

Designing smarter internal tools: How redesigning a logging tool boosted efficiency and employee experience
Synthetic data was used in this article to anonymize the commissioning organization and protect confidentiality.
Digital tools are intended to support daily work, but internal systems are often overlooked when it comes to usability. Tools like logging systems may seem small, yet they play a significant role in employee experience and performance. This article presents the outcomes of a case study where service design and change management were used to improve an internal tool in a Finnish technical support contact center.
A practical problem with real impact
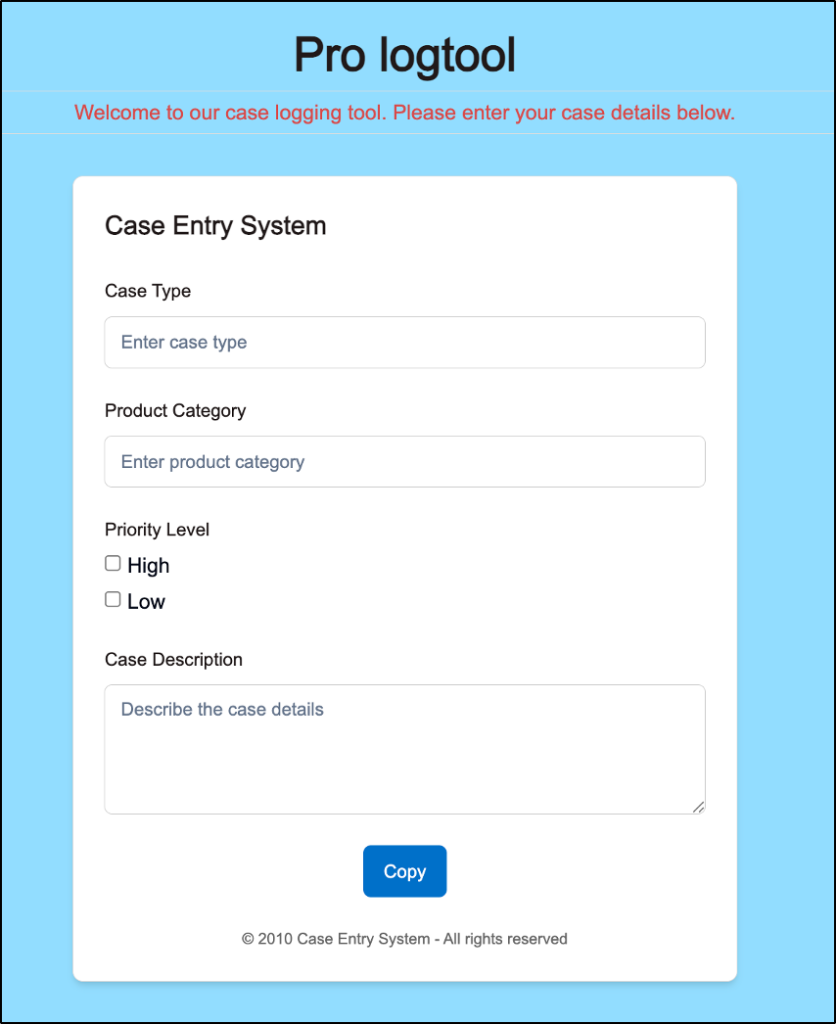
The logging tool in use required customer support agents to record every service case. Each log took around 40 seconds to complete, which might not sound like much, but multiplied by dozens of cases per agent and over 150 employees, the lost time was considerable. Beyond efficiency, the tool was described as slow and not aligned with everyday work tasks.
To solve this, the organization launched a development initiative using service design, a method that focuses on understanding and improving experiences for users – in this case, the employees. Interviews, workshops, and structured user feedback helped shape a redesigned version of the tool that better matched the needs of its users.
Applying the Service Design Framework
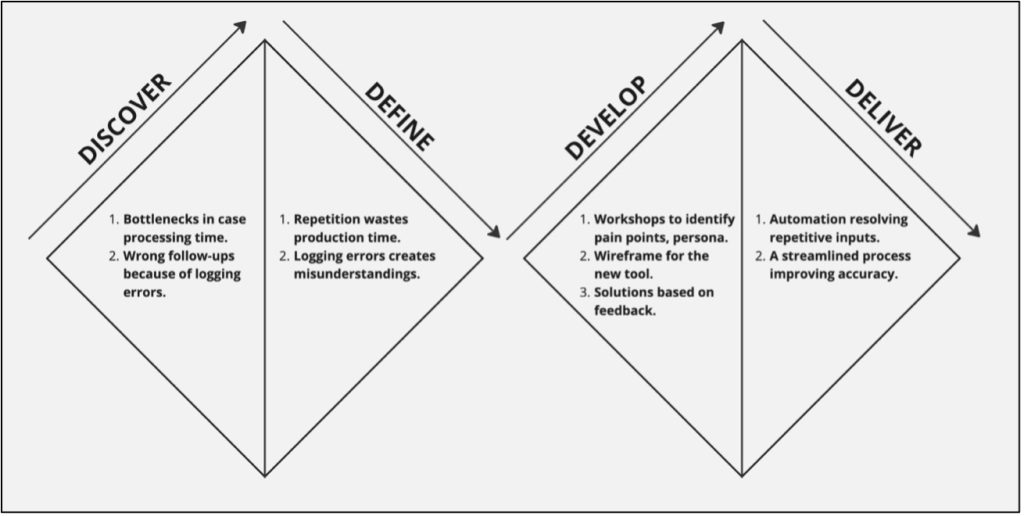
The project followed the Double Diamond model, a widely used service design framework. This model includes four stages: Discover, Define, Develop, and Deliver. It helps teams explore problems broadly before narrowing in on targeted solutions.
In the Discover phase, the team gathered insights through interviews and observation to identify pain points. In Define, the findings were turned into clear problem statements and service blueprints. During Develop, ideas were co-created with staff and tested through prototypes. Finally, the Deliver phase introduced a working version of the tool, which included a feedback option and a gamified feature to keep users engaged. Each step was grounded in input from the people who use the tool daily.
From friction to flow
The new tool brought visible improvements. Logging time dropped to 18 seconds per case. Repetitive actions were automated. The interface became easier to use. A feedback button allowed users to suggest improvements, and light gamification encouraged regular use. Altogether, the changes saved an estimated 16 working hours per day for the team.
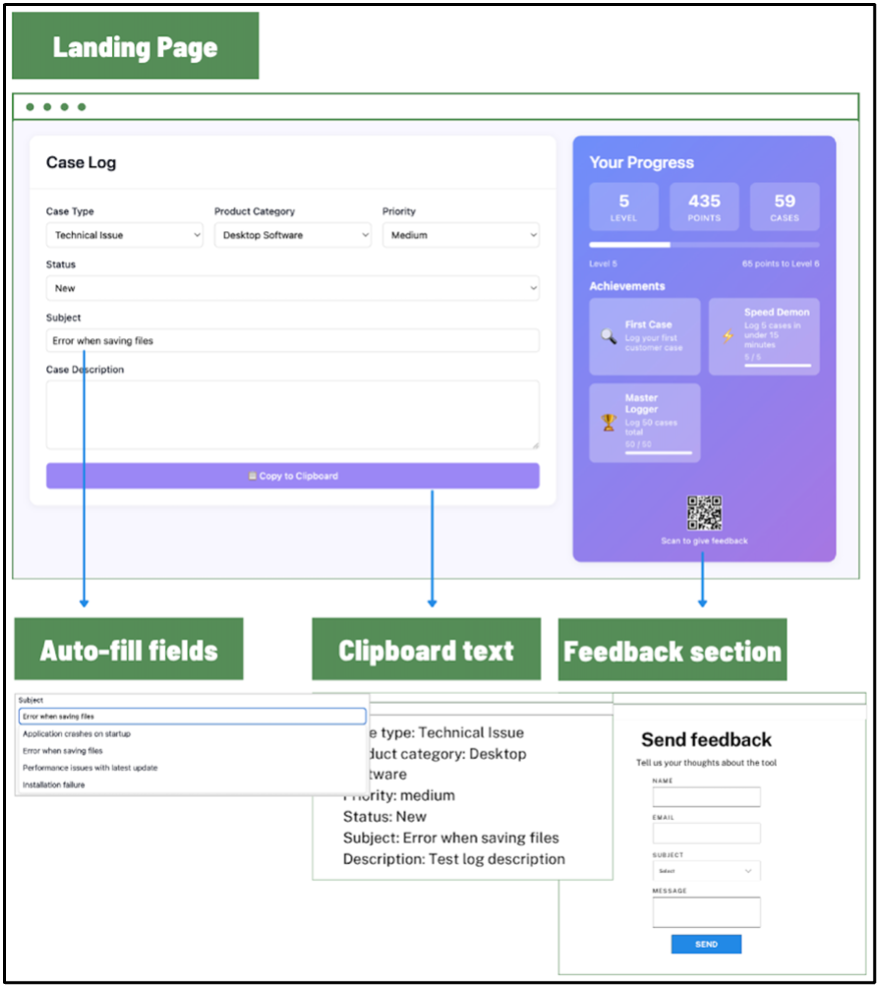
The result was a new version of the logging tool that:
- Reduced logging time from 40 to 18 seconds per case
- Automated repetitive tasks and added gamification to encourage use
- Improved the interface for speed and clarity
- Allowed continuous feedback directly within the tool
Employees were not just told about the change, they helped build it.
Supporting change with structure
Improving the tool’s design alone was not enough. Some employees were unsure about the changes. The team applied structured change management practices, including open communication, early testing, and support. Employees were not just told about the change, they helped build it. This created a stronger sense of ownership and reduced resistance. The project combined a clear process with space for individual ideas, which helped build trust and made people more open to future changes. Service design and change management together formed a practical, people-centered model that others can follow.
References
Artificial intelligence has been used in the work as follows:
ChatGPT 2025. OpenAI. GPT-4o. Accessed for language check, June 2025. https://chat.openai.com
Adobe Firefly. (2025). https://firefly.adobe.com/
Ekholm, J. (2025). Optimizing a logging process for contact center solutions. Turku University of Applied Sciences, Master’s Thesis.
Figures
Figure 1. Screenshot of the logging tool that was about to be replaced.
Figure 2. A double diamond diagram based on the key findings.
Figure 3. The complete wireframe of the new logging tool.