
Risk profiling tool for diseases by cluster analysis
Clustering is a powerful machine learning tool for detecting structure in datasets. Cluster analysis is a data mining technique that divides research objects into groups with similar relative attributes.
Background
Over 90% of thrombus aggregation occurs in the left atrial appendage (Wikipedia, 2018). Left atrial appendage closure (LAAC) is an alternative treatment for lowering and preventing stroke.
This thesis used the dataset of 153 patients from Turku University Hospital. The dataset includes medical history information, hospitalization information, and five-year follow-up data of LAAC procedures patients. A cluster analysis tool was created for risk profiling through patients’ characteristics by the k-modes algorithm.
About Machine Learning
Classical learning systems need the data and the rules to obtain answers or results. However, machine learning systems “learn” the rules from looking at the data and the answers related to that data (Subramanian, 2018). After that the algorithm finds the rules as in Figure 1.
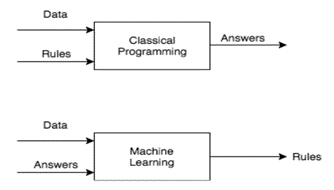
Machine learning falls into supervised and unsupervised learning, depending on whether we know the answers. As demonstrated in the image, supervised learning handles the challenge of extracting rules from a set of data and labels (above referred to as questions and answers). We only know the data in unsupervised learning, but the labels are unknown. Unsupervised learning means that the data obtained is unlabeled, and it is necessary to find a valuable structure or grouping that may be hidden. This can be seen in Figure 2.

Clustering analysis
Clustering is one of the most significant and widely utilized algorithms in data science and machine learning. In this type of problem, clustering is a method that helps to organise the dataset to subgroups, i.e. clusters (Likas et al., 2003). The clustering algorithm belongs to unsupervised learning.
In pattern recognition and data mining, k-means (MacQueen, 1967) algorithms are commonly employed to tackle data categorisation and grouping challenges. In Figure 3 there are three clusters and their centroids i.e. their center points marked.

When datasets with continuous properties are eligible for the classic k-means technique, k-modes is a k-means version that defines cluster centroids using modes of categorical variables and calculates distances using the Hamming dissimilarity metric (Hamming, 1950). Non-numerical data could also be encoded into numbers to apply k-means clustering, but it is argued that Euclidean computing distance to categorical attributes is not very meaningful. As the name suggests, the algorithm uses statistical mode instead of mean in assigning the cluster members. The distance measure is calculated by using one of (but not restricted to) selected dissimilarity metrics discussed below. A method also combines k-means and k-modes for both continuous and categorical datasets (Kumar, 2021).
In this thesis, the most common type of survey questions in postoperative follow-up studies of patients is to select several data items from the patient’s medical history or other discrete characteristic data items, such as whether there is hypertension, thromboembolism, and other information items. The value of these categorical attribute data is usually ”yes,” ”no,” and ”unknown.” So the k-modes algorithm will suffice.
Results
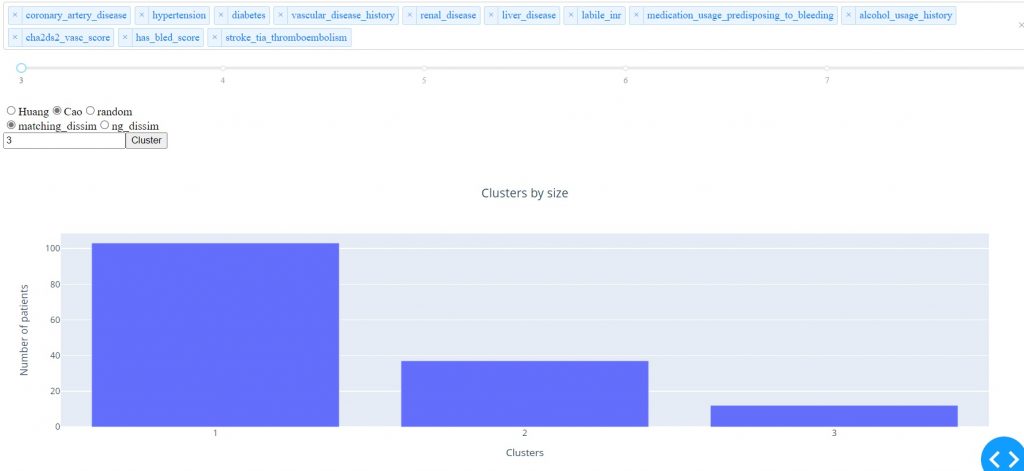
Implemented here through the Cao method and matching dissimilarity algorithm, the number of clusters is 3. The result is shown in Figure 4.
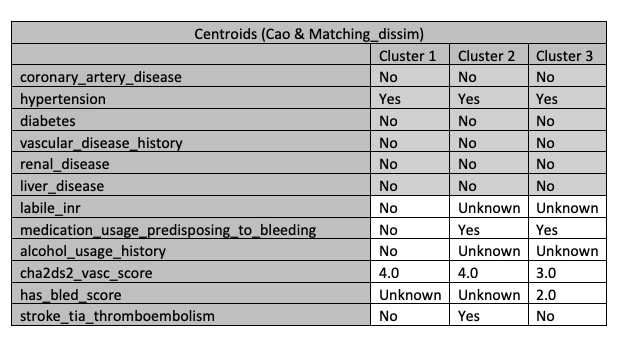
The properties of the three clusters can be shown in Figure 5. There we can see, for example, the values of cluster 1. The data in cluster 1 contains patients that did not get the certain medication compared to the other clusters. Unfortunately there are unknown values in the table.
One year after the patients underwent LAAC procedures, the situation of stroke was shown in Figure 6. Only in the first cluster, there were some patients who had a complication of stroke.
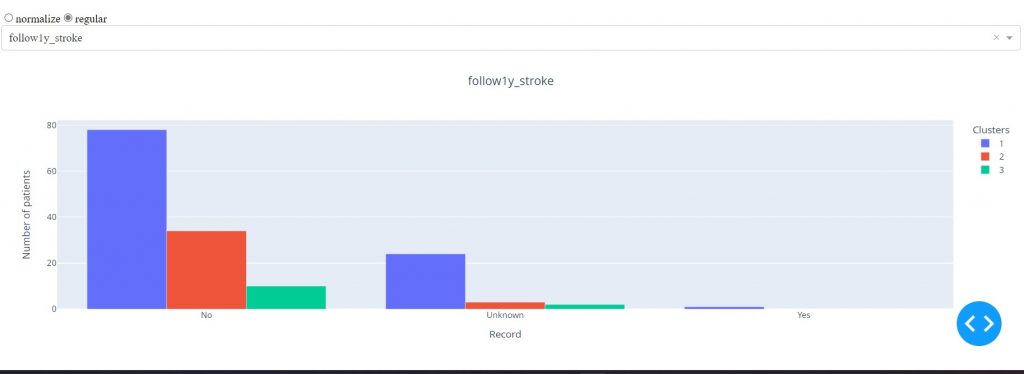
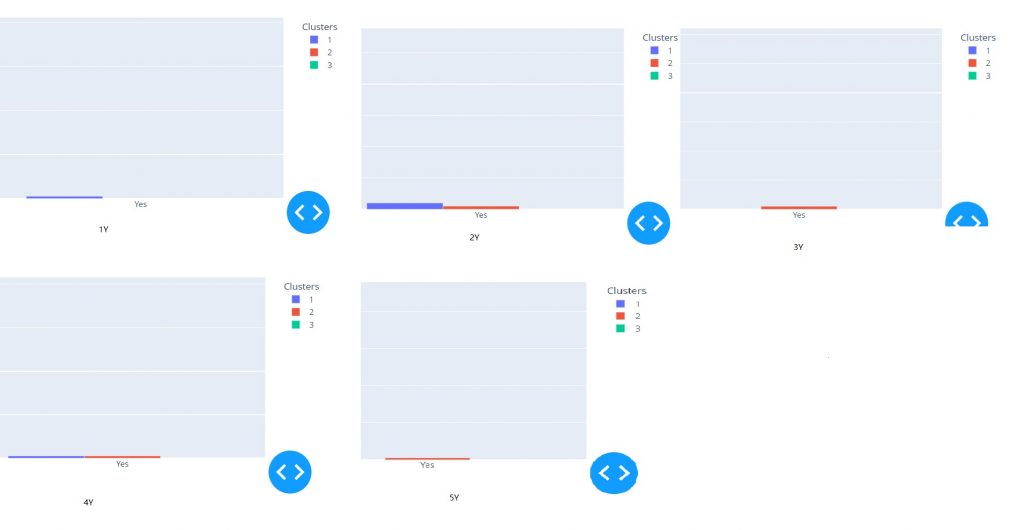
Figure 7 shows time series from one to five years after the LAAC. The stroke complications were in the first cluster and second cluster, not in the third cluster. During the same time, the TIA and thromboembolism complications only occurred in the first and second clusters five years after the LAAC procedures.
Conclusion and further development
The first and second clusters are high-risk groups, and the third cluster is the low-risk group. The first and second risk clusters deserve more attention and tracking. For new patients, we can compare the latest patient data with the clusters’ centroids obtained by the cluster analysis tool. We can effectively determine the risk group that the patient belongs to and then give more tracking and preventive measures.
There exist more ideal clustering analyses through more dissimilarity algorithms and initialization methods. They can be used in the future research. The tool applies on the risk profiling of other diseases too.
References
Hamming, R. W. (1950). Error detecting and error correcting codes.
Kumar, S. (2021). Clustering Algorithm for data with mixed Categorical and Numerical features – k-Modes and k-Prototype algorithm intuition and usage. https://towardsdatascience.com/clustering-algorithm-for-data-with-mixedcategorical-and-numerical-features-d4e3a48066a0
Likas, A., Vlassis, N., & J. Verbeek, J. (2003). The global k-means clustering algorithm. Pattern Recognition, 36(2), 451–461. https://doi.org/10.1016/S0031-3203(02)00060-2
Ma, Y., Liu, K., Guan, Z., Xu, X., Qian, X., & Bao, H. (2018). Background augmentation generative adversarial networks (BAGANs): Effective data generation based on GAN-augmented 3D synthesizing. Symmetry, 10(12). https://doi.org/10.3390/sym10120734
MacQueen, J. (1967). Some methods for classification and analysis of multivariate observations.
Subramanian, V. (2018). Deep Learning with PyTorch. Wikipedia, (2018). LEFT ATRIAL APPENDAGE OCCLUSION. https://en.wikipedia.org/wiki/Left_atrial_appendage_occlusion
Zhang, J., Chen, W., Gao, M., and Shen, G., (2017).”K-means-clustering-based fiber nonlinearity equalization techniques for 64-QAM coherent optical communication system,” Retrieved https://opg.optica.org/oe/fulltext.cfm?uri=oe-25-22-27570&id=375887
Shi Suxin (2022): Risk profiling patients with left atrial appendage closure using the k-modes algorithm. Bachelor’s thesis Information and Communications Technology, Turku University of Applied Sciences,