The Cost of Poor Quality
Many companies management should realize that the cost of poor quality can be a significant part of company expenses. For example, the realized level of these costs can be between 15-20% of company turnover. When preventive actions to avoid receiving defective components are correctly targeted, the savings can be significant.
Quality costs are one of the most important KPIs for a company, but they have been measured by a very small number of companies, although they can be used to achieve significant financial results. (Murumkar et al., 2017)
By conducting a quality cost analysis on a small scale, a company can also identify areas for improvement and potential savings. (Murumkar et al., 2017)
Quality cost analysis can help a company find the best balance between different quality costs in the long-term. (American Society for Quality 2024)
Quality Models and Future Goals
In the thesis, Syrjänpää (2024) examines different quality models and techniques on how to get the lowest total costs for quality.
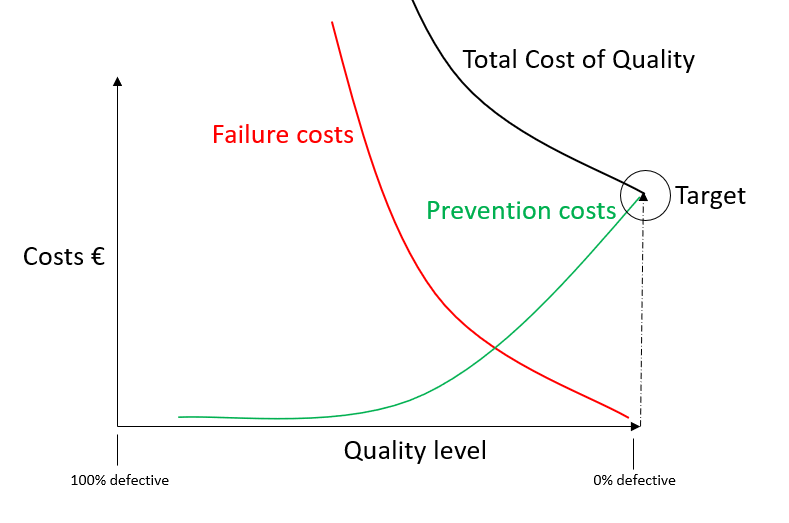
Arthur M. Schneiderman (1986) and Joseph M. Juran and Gryna F. M. (1988, 1993) created a modern quality cost model, which is also published in Juran’s 5th quality handbook in 1999. Philip B. Crosby, Plunkett J. J., Dale B. G., and Freiesleben J. also agreed that when prevention costs are the only cost of quality and the share of received defective parts is 0%, it is the lowest cost level. (Tomov & Velkoska, 2021)
The picture below describes a modern cost of quality model. Based on: (Tomov & Velkoska, 2021)

Development Work and Research Methods
The thesis was done as a development work for the commissioning company, utilizing various research methods.
Information on the duration of repair of defective parts was collected through the ERP system, but interviews also provided important information on for example the different average duration of work tasks and the prices of packages. The measurement period lasted three months, which was estimated to produce enough data to be studied, but to surprise, the amount was about twice as much as expected.
Research questions helped guide data processing as well as the creation of tables to show answers to assistive research questions, which were as follows.
The main question is:
- How much does one supplier’s quality error cost for the commissioning company?
Additional questions:
- How many percent of found non-conformity parts are repaired in-house?
- How big are the differences between the component categories?
- What are the main factors contributing to quality costs in the assembly process?
- How can the identification and categorization of defective components be improved?
- What is the potential savings from reducing quality costs?
- How big are the differences in suppliers’ quality costs?
- What development actions can be implemented to minimize the occurrence of defective components?
Results
The most important result of the work is the cost list created for each component category due to the differences between them, but also for the study, the average price for all components was calculated as planned. In the example calculation that was 137,5 EUR per each non-conformity component found in production.
In addition, category-specific prices were utilized for the suppliers and their claim quantity, which revealed the suppliers with the highest costs during this investigation. This was same time the first step in the journey to a create quality cost model tool. (Syrjänpää, 2024)
Conclusions
One of the biggest development opportunities is a part of the supplier claim processes, where the share of repair work invoiced needs to reach a higher level and thus reduce the total costs. When more quality costs are defined in the future, it’s easier to find better solutions to avoid quality problems with supplier components and also prove the results in money.
The calculated example savings potential for the development actions is over 660,000 EUR. It has already been decided that development projects will continue for the commissioning company based on the thesis.
You can read more about this subject in the thesis, which can be found in Theseus.
References
American Society for Quality. (2024). Cost of Quality (COQ). https://asq.org/quality-resources/cost-of-quality
JAMK. (2019). Väärinymmärretyt laatukustannukset – hyödyntämätön voimavara kehittämisessä.
https://blogit.jamk.fi/techtothefuture/2019/11/14/vaarinymmarretyt-laatukustannukset-hyodyntamaton-voimavara-kehittamisessa/
Murumkar, A., Teli, S.N., Bhushi, U., Deshpande, A. (2017). Hidden Cost of Quality: A Review.
https://www.researchgate.net/publication/321706247_Hidden_Cost_of_Quality_A_Review
Syrjänpää, J. (2024). Costs of Poor Quality. Turku University of Applied Sciences Thesis.
https://urn.fi/URN:NBN:fi:amk-2024121636076
Tomov, M. & Velkoska, C. (2021). ANALYSIS AND TRENDS OF THE CHANGES IN THE GRAPHIC INTERPRETATION OF THE QUALITY COSTS MODELS.
https://www.researchgate.net/publication/354960635_ANALYSIS_AND_
TRENDS_OF_THE_CHANGES_IN_THE_GRAPHIC_INTERPRETATION_OF_THE_QUALITY_COSTS_MODELS
Picture @ geralt from Pixabay